Exam and Assessment Results.
KS3 Outcomes
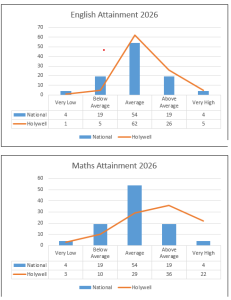
Our KS3 students take nationally benchmarked tests for English and Maths (GL Assessments). We use these assessments so that we can track the progress of our students from intake to point of leaving. Results demonstrate that students have continued to perform in excess of the national averages – which has been typical of our KS3 outcomes over the last few years.
Below are our Provisional 2025 KS2 SATs results along with our previous assessment results.
| Holywell | National |
READING | 55.9% (GD 18%) | 75% |
GPAS | 52.5% (GD 11.9%) | 74% |
WRITING TA | 51.1% (GD 3.37%) | 73% |
MATHS | 65.5% (GD 22%) | 75% |
| ||
RWM | 40.1% | 63% |
Results 2026 – End of Key Stage 2 – Year-on-Year comparison
Number of pupils achieving national standard | % Pupils achieving national standard | Number of pupils achieving above national standard | % Pupils achieving above national standard or a greater depth | |
RWM Combined 2026 | 71/177 | 40% (NA 63%) | 5/177 | 3% (NA tbc) |
RWM Combined 2025 | 49/184 | 27% (NA 62%) | 1/184 | 0.54% (NA 8%) |
RWM Combined 2024 | 102/179 | 57% (NA 61%) | 6/179 | 3.35% (NA 8%) |
RWM Combined 2023 | 97/180 | 54% (NA 59%) | 13/180 | 7.22% (NA 8%) |
RWM Combined 2022 | 104/180 | 58% (NA 59%) | 4/180 | 2.22% |
RWM Combined 2019 | 94/157 | 60% (65%) | 11/157 | 7% |
RWM Combined 2018 | 107/158 | 68% (NA 64%) | 19 | 12% |
RWM Combined 2017 | 100 | 63% (NA 61%) | 19 | 12% (9% NA) |
RWM 2016 | 80 | 54% (NA 53%) | 9 | 6% (5% NA) |
Reading 2026 | 99/177 | 56% (NA 75%) | 32/177 | 18% (NA tbc) |
Reading 2025 | 118/184 | 64% (NA 75%) | 38/184 | 21% |
Reading 2024 | 127/179 | 72% (NA 74%) | 41/179 | 23% |
Reading 2023 | 126/180 | 70% (NA 73%) | 39/180 | 22% |
Reading 2022 | 135/180 | 75% (NA 74%) | 41/180 | 23% |
Reading 2019 | 114/157 | 73% (NA 73%) | 45/157 | 29% |
Reading 2018 | 124/158 | 78% (NA 75%) | 51 | 32% |
Reading 2017 | 117 | 74% (NA 71%) | 39 | 25% (18% NA) |
Reading 2016 | 99 | 67% (NA 66%) | 27 | 18% (19% NA) |
Writing 2026 | 92/177 | 51% (73%) | 6/177 | 3% (NA tbc) |
Writing 2025 | 54/184 | 29% (NA 72%) | 1/184 | 0.54% |
Writing 2024 | 129/179 | 72% (NA 72%) | 11/179 | 6% |
Writing 2023 | 126/180 | 70% (NA 71%) | 16/180 | 9% |
Writing 2022 | 130/180 | 72% (NA 69%) | 20/180 | 11% |
Writing 2019 | 111/157 | 71% (NA 78%) | 15/157 | 10% |
Writing 2018 | 127/158 | 80% (NA 78%) | 38 | 24% |
Writing 2017 | 128 | 81% (NA 76%) | 28 | 18% |
Writing 2016 | 114 | 77% (NA 74%) | 24 | 16% (NA 15%) |
GPAS 2026 | 93/177 | 53% (NA 74%) | 21/177 | 12% (NA tbc) |
GPAS 2025 | 112/184 | 61% (NA 73%) | 27/184 | 15% |
GPAS 2024 | 118/179 | 66% (NA 72%) | 38/179 | 21% |
GPAS 2023 | 112/180 | 62% (NA 72%) | 36/180 | 20% |
GPAS 2022 | 132/180 | 73% (NA 72%) | 41/180 | 23% |
GPS 2019 | 125/157 | 80% (NA 78%) | 33/157 | 21 |
GPS 2018 | 123/158 | 78% (NA 78%) | 44 | 28% |
GPS 2017 | 114 | 74% (NA 77%) | 25 | 16% (31% NA) |
GPS 2016 | 109 | 74% (NA 72%) | 18 | 12% (NA 23%) |
Maths 2026 | 116/177 | 65% (75%) | 38/177 | 21% (NA tbc) |
Maths 2025 | 129/184 | 70% (NA 74%) | 30/184 | 16% |
Maths 2024 | 132/179 | 74% (NA 73%) | 41/179 | 23% |
Maths 2023 | 135/180 | 75% (NA 73%) | 35/180 | 19% |
Maths 2022 | 129/180 | 72% (NA 71%) | 47/180 | 26% |
Maths 2019 | 127/157 | 81% (NA 79%) | 47/157 | 30 |
Maths 2018 | 130/158 | 82% (NA 76%) | 47 | 30% |
Maths 2017 | 122 | 77% (NA 75%) | 39 | 25% |
Maths 2016 | 103 | 68% (NA 70%) | 20 | 14% (NA 17%) |